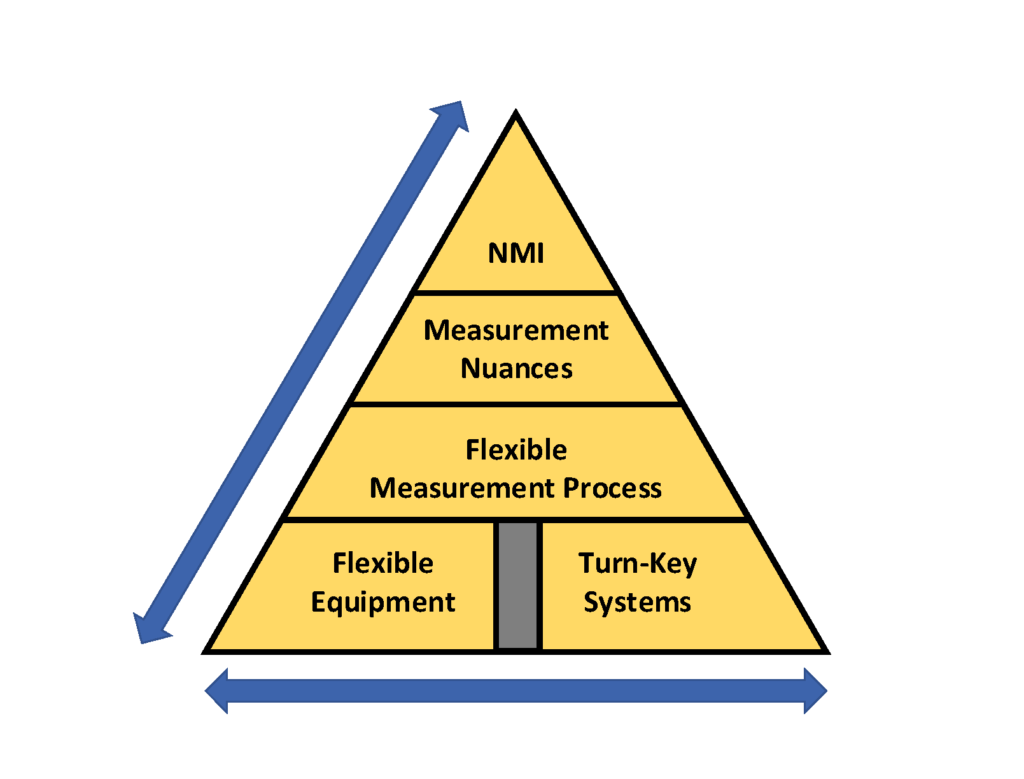
I have been developing automated calibration procedures for more than 20 years now, and if there is one thing I have learned is no two projects are the same! Metrology Software and its complexity can be compared to the traceability pyramid. The closer you are to the peak, the more facets and nuances there are to the test process.
This can be easily explained when looking at a Fluke 87 calibration versus a Keysight 3458A verification procedure. The Fluke 87 and most handheld DMMs are 3½ digit volt meters with accuracies in the .1% range, whereas, the Keysight 3458A is an 8 ½ digit volt meter with accuracy in the parts per million range. The 3458A is something like 1000 times more accurate than a handheld DMM; the complexity of the automation is almost the same.
Most multifunction calibrators are able to calibrate 3½ to 5½ digit multimeters straight up, meaning the calibrator is accurate enough to allow you to simply output the voltage and measure it with the voltmeter. This makes writing the automation easy—setup commands to the calibrator and the DMM, output on, measure, output off, and on to the next test point.
But to calibrate an 8½ digit meter, the problem there is that most of those meters are more accurate than the multifunction calibrator. So, you can’t simply output a value and measure it; no, this is primary level metrology. This is the top two sections of the pyramid, and for many countries, NMI level calibration work.
For this level of metrology, you are often comparing a measurement to a measurement using a stable transfer standard, accounting for all the things that can affect your measurement. Things like projected drift of a 10 V cell has to be calculated. Thermal stability of the environment plays a role—3458As have an internal thermometer so the user can check the stability.
When you are calibrating a meter 1000 times more accurate than the everyday meter, every source of error has an effect on the measurement! This is why the software is more complex. Often there are corrections, calculations, and even drift charts for everything used in the calibration. And the software has to keep track of the data, perform the calculations, and produce corrected measurement with the corresponding uncertainty.
This is part of what makes the software more difficult to write, support, and maintain. And now you have the added complexity that most of the top tier labs in the world don’t use the exact same hardware. At that level, a 30 year old standard with drift data is more valued than the newest standards. The problem is 30 years of data is known, but with newer standards, how that standard will perform 30 years from now, well that’s unknown!
It’s not just the difference in hardware that complicates the software. It’s also the technician and the lab environment. Something as simple as using a different type of test lead can drastically affect the measurement result. I once tracked a problem down to the number of twists in the cabling that was causing the numbers to be off. Software can only do so much.
Most managers think primary level automation is the same as the simple 3½ digit stuff. They want to buy automation and have it pumping out 3458A option 002 calibration at 90 day specs with 4 to 1 TUR the next morning!
It’s not impossible. It just takes a little time to work through all the non-software errors that can blow up a measurement, evaluate what can be updated or handled in the software and measurement process, collect and evaluate the data, updates made, and then the cycle repeats until it’s right.
In the end, there is no substitute for good metrology when writing primary/NMI level automation. Software at this level is like an atomic clock—you just can’t pick up and move primary level automation to another lab and expect to get the same results!